

Aermax helps improve IAQ at a leading coaching institute chain in India
Aermax helps improve IAQ at a leading coaching institute chain in India
Aermax helps improve IAQ at a leading coaching institute chain in India
SITE 1: Central Kolkata
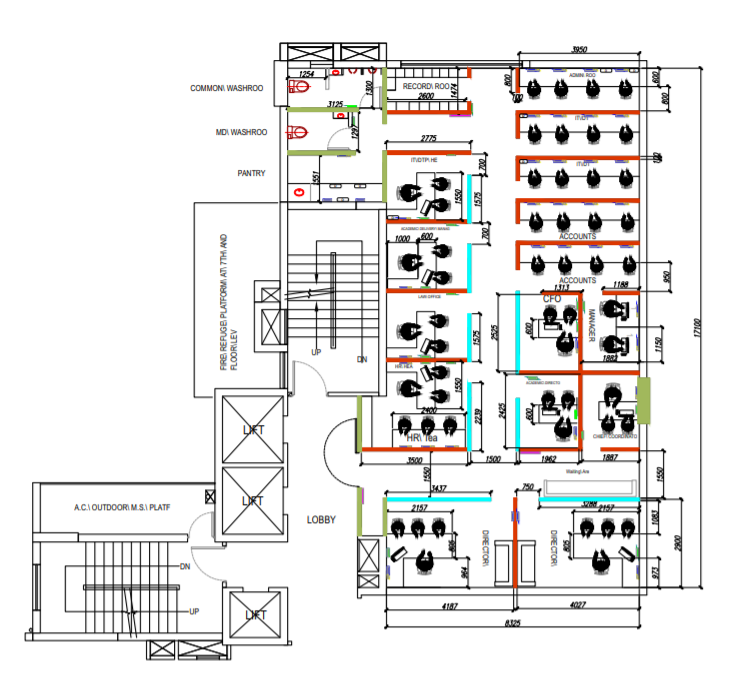
Floor Plan of Office
Observation
Range of pollutants found in testing zone
|
Pollutants |
Value |
Boundary condition |
|
PM 2.5 µg/m3 |
222 |
The acceptable level of PM 2.5 is ≤ 30 |
|
PM 10 µg/m3 |
245 |
The acceptable level of PM 10 is ≤ 100 |
|
TVOC (ppm) |
33456 |
Acceptable level is 160 i.e 0.3 mg/m3. |
|
AQI (Index) |
376 |
Which shows the tested zone is very poor according to AQI index |
Table 1.1 Pollutants level
From table 1.1 it can be seen that in the tested zone PM 2.5 was very high and was constant throughout the measured time, the mass concentration was found to be 222 μg/m3 which is 7.4 times higher than the acceptable level. PM 10 was also crossing the acceptable limit with an average of 245 μg/m3, where the boundary lies below 100. TVOC was found to be the highest source of pollution after PM 2.5, where the ppm spiked up higher up to 33456 ppm and the limit is only 160 ppm i.e. 0.3 mg/m3. The Air Quality Index (AQI) was found to be 376 and the value lies in severe range, where AQI less than or equal to 50 is considered as good.
Solution
Based on the area of the tested site, structure and the number of employees we propose a solution of recommending two units of “Aermax 500” and one unit of “CS250” (Ceiling suspended) air cleaning systems in order to ensure clean air is distributed to the overall space and provide a safe environment for the students and employees. The ideal recommendation for the site would be to install two AerMax 500 and one CS250 given the location and pollution level around the site.
|
Recommended Unit |
Quantity |
|
Aermax 500 |
2 |
|
CS250 |
1 |
SITE 2: South Kolkata

Floor Plan of Office**
Observation
Range of pollutants found in testing zone
|
Pollutants |
Value |
Boundary condition |
|
PM 2.5 µg/m3 |
123.4 |
The acceptable level of PM 2.5 is ≤ 30 |
|
PM 10 µg/m3 |
138.4 |
The acceptable level of PM 10 is ≤ 100 |
|
TVOC (ppm) |
53.7 |
Acceptable level is 160 i.e 0.3 mg/m3. |
|
AQI (Index) |
302 |
Which shows the tested zone is very poor according to AQI index |
Table 2.1 Pollutants level
From table 2.1 it can be seen that in the tested zone PM 2.5 was very high and tends to be increasing due to the frequent movement of employees and visitors, the average mass concentration was found to be 123.4 µg/m3 which is 4.1 times higher than the acceptable level. The PM10 was also crossing the acceptable limit with an average of 138.4 µg/m3, where the boundary lies below 100. The overall Air Quality Index (AQI) was found to be 302 and the value lies in severe whereas AQI less than or equal to 50 is considered as good. It is observed that the pollutant level is very high and the AQI is severe which may cause several health issues to the employees and the visitors also.
Solution
Based on the area of the tested site, structure and the number of employees we propose a solution of recommending two units of “CS250” which is a ceiling suspended air cleaning system in order to ensure clean air is distributed to the overall space and provide a safe environment for the students and employees.
|
Recommended Unit |
Quantity |
|
CS250 |
2 |
SITE 3: Bansdroni Center

Floor Plan of Office**
Observation
Range of pollutants found in testing zone
|
Pollutants |
Value |
Boundary conditions |
|
PM 2.5 µg/m3 |
89.6 |
The acceptable level of PM 2.5 is ≤ 30 |
|
PM 10 µg/m3 |
112.4 |
The acceptable level of PM 10 is ≤ 100 |
|
TVOC (ppm) |
109 |
Acceptable level is 160 i.e 0.3 mg/m3. |
|
AQI (Index) |
220 |
Which shows the tested zone is very poor according to AQI index |
Table 3.1 Pollutants level
From table 3.1 it can be seen that in the tested zone PM 2.5 was high and was constant throughout the measured time, the average mass concentration was found to be 89.6 µg/m3 which is 2.9 times higher than the acceptable level. The PM10 was also crossing the acceptable limit with an average of 112.4 µg/m3, where the boundary lies below 100. The overall Air Quality Index (AQI) was found to be 220 and the value lies in poor according to AQI, whereas AQI less than or equal to 50 is considered as good. It is observed that the pollutant level is very high and the AQI is poor which may cause several health issues to the employees and the visitors also.
Solution
Based on the area of the test site, structure and the number of employees we propose a solution of recommending a single unit of “Aermax 500” in order to provide clean air throughout the entire space and provide a safe environment for the students and employees.
|
Recommended Unit |
Quantity |
|
Aermax 500 |
1 |
SITE 4: Anandlok office

Floor Plan of Office**
Observation
Range of pollutants found in testing zone
|
Pollutants |
Value |
Boundary Conditions |
|
PM 2.5 µg/m3 |
98 |
The acceptable level of PM 2.5 is ≤ 30 |
|
PM 10 µg/m3 |
120.3 |
The acceptable level of PM 10 is ≤ 100 |
|
TVOC (ppm) |
579 |
Acceptable level is 160 i.e 0.3 mg/m3. |
|
AQI (Index) |
237 |
Which shows the tested zone is very poor according to AQI index |
Table 4.1 Pollutants level
From table 4.1 it can be seen that in the tested zone PM 2.5 was high and was constant throughout the measured time, the average mass concentration was found to be 98 µg/m3 which is 3.3 times higher than the acceptable level. The PM10 was also crossing the acceptable limit with an average of 120.3 µg/m3, where the boundary lies below 100. The overall Air Quality Index (AQI) was found to be 237 and the value lies in poor condition according to AQI, whereas AQI less than or equal to 50 is considered as good. It is observed that the pollutant level is very high and the AQI is poor which may cause several health issues to the employees and the visitors also.
Solution
Based on the area of the test site, structure and the number of employees we propose a solution of recommending a single unit of “Aermax 500” in order to provide clean air throughout the entire space and provide a safe environment for the students and employees.
|
Recommended Unit |
Quantity |
|
Aermax 500 |
1 |
SITE 5: North Kolkata office

Floor Plan of Office**
Observation
Range of pollutants found in testing zone
|
Pollutants |
Value |
Boundary conditions |
|
PM 2.5 µg/m3 |
101 |
The acceptable level of PM 2.5 is ≤ 30 |
|
PM 10 µg/m3 |
135.1 |
The acceptable level of PM 10 is ≤ 100 |
|
TVOC (ppm) |
42 |
Acceptable level is 160 i.e 0.3 mg/m3. |
|
AQI (Index) |
238 |
Which shows the tested zone is very poor according to AQI index |
Table 5.1 Pollutants level
From table 5.1 it can be seen that in the tested zone PM 2.5 was high and was constant throughout the measured time, the average mass concentration was found to be 101 µg/m3 which is 3.36 times higher than the acceptable level. The PM10 was also crossing the acceptable limit with an average of 135.1 µg/m3, where the boundary lies below 100. The overall Air Quality Index (AQI) was found to be 238 and the value lies in poor condition according to AQI, whereas AQI less than or equal to 50 is considered as good. It is observed that the pollutant level is very high and the AQI is poor which may cause several health issues to the employees and the visitors also.
Solution
Based on the area of the test site, structure and the number of employees we propose a solution of recommending two units of “Aermax 500” in order to provide clean air throughout the entire space and provide a safe environment for the students and employees.
|
Recommended Unit |
Quantity |
|
Aermax 500 |
2 |
SITE 6: Barrackpore office
Solution
Based on the area of the test site, structure and the number of employees we propose a solution of recommending 1 unit of AerMax 500 in order to provide clean air throughout the entire space and provide a safe environment for the students and employees.
|
Recommended Unit |
Quantity |
|
AerMax 500 |
1 |
Report by: Dr. Felix Swamidoss
Research Associate
Spectrum Filtration
Kolkata
Site Information
Test ZONE: 1
Test repeated with” Aermax 500” at speed- 3
Device USED: Aermax 500
Monitor used: Kaiterra sensedge
-
Range of pollutants found in testing zone, prior to the use of “Aermax 500”
From table 1.1 it can be seen that in the tested zone PM 2.5 was very high and was constant throughout the measured time, the mass concentration was found to be 221 µg/m3which is 7.3 times higher than the acceptable level. PM 10 was also crossing the acceptable limit with an average of 255 µg/m3, where the boundary lies below 100. TVOC was found to be the highest, where the ppm spiked up higher up to 1762 ppm and the limit is only 160 ppm i.e. 0.3 mg/m3 . The Air Quality Index (AQI) was found to be 378 and the value lies in severe, where AQI less than or equal to 50 is considered as good.
|
Pollutants |
Value |
Boundary conditions |
|
PM 2.5 µg/m3 |
221 |
The Good level of PM 2.5 is ≤ 30 |
|
PM 10 µg/m3 |
255 |
The acceptable level of PM 10 is ≤ 100 |
|
TVOC (ppm) |
1762 |
Acceptable level is 160 i.e 0.3 mg/m3. |
|
AQI (Index) |
378 |
Which shows the tested zone is severe according to AQI index |
Table 1.1 Pollutants level: Without the use of “Aermax 500”
-
Range of pollutants found in testing zone with the use of “Aermax 500”
After the installation of “Aermax 500” it was observed there was a moderate reduction of pollutant levels. From table 1.2 it is seen that the mass concentration of PM 2.5 was reduced from 221 µg/m3 to 46 µg/m3 which is an acceptable level. PM 10 was found to reduce from 255 µg/m3 to 53 µg/m3. The overall AQI after the performance of “Aermax 500” was below 80, which comes satisfactory category according to AQI index. The other pollutant such as CO2 did not vary because it depends on the number of occupants presented in the room.
|
PM 2.5 µg/m3 |
PM 2.5 |
46 |
PM 2.5 is satisfactory and was constant for a particular time. |
|
PM 10 µg/m3 |
PM 10 |
53 |
The acceptable level of PM 10 is ≤ 100 |
|
TVOC (ppm) |
TVOC |
- |
-µg/m3 |
|
AQI (Index) |
AQI |
76 |
Where the AQI gets satisfactory. |
|
CO2 (PPM) |
CO2 |
653 |
Moderate |
Table 1.2 Pollutants level: With the use of “AERMAX 500” at speed “3”

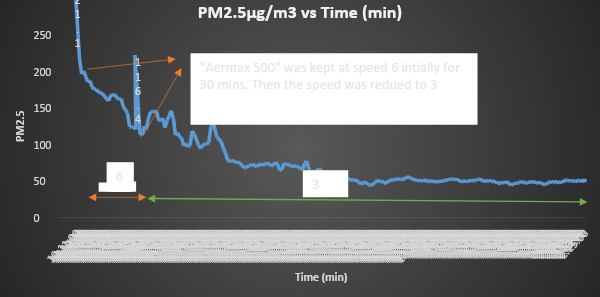
Fig 1: Comparison of AQI vs Time & PM 2.5 vs Time with use of “AerMax 500”
From fig 1. It is seen that PM 2.5 was in the range of above 221 and AQI was above 378 for the measured period of time without the use of “Aermax 500”, it is also seen that after the installation of “Aermax 500” the mass concentration reduced drastically when operated at speed - 6.
When kept at speed -3 there was a slight increase in small peaks which were due to the outdoor air that comes from the exit door and then the reduction started again which was constant during the entire period of measurement. The reduction in pollutant level was maintained throughout the period of measurement by “Aermax 500” which made the environment safe and healthy throughout the day.
Hence, during the use of “Aermax 500” it is recommended to start running the purifier at speed 6 for at least 30 minutes in order to get a quick reduction in pollutant level.
You may also like

Aim: To determine the air quality of the office space where filters in AHU are installed with MERV 8 filters, and to analyze the environment of the site to find other sources of pollutants.
Read More
With the fear of COVID-19 looming, everyone is looking for ways to mitigate the risks at homes, offices, schools, and other public settings like malls, hospitals, restaurants, gyms, dental clinics, and even salons. Employers are looking for ways to initiate and optimize operations at the work place itself.
Read More